News and Insights
Explore the EdenTree Investment News and Insights page, offering timely and informative content to navigate the dynamic world of investments and make informed decisions.

Opinion
The case for optimism in sustainable government debt
With improving data quality and an ever-growing universe of green sovereign bonds, sustainable investors are increasingly able to align their portfolios with their sustainability goals without having to compromise on integrity, writes David Katimbo-Mugwanya, Head of Fixed Income at EdenTree.
read moreFilter by
Loading
In the News 24 Jun 2025
Scaling Solutions: The Fixed Income Opportunity in Plain Sight – EdenTree Global Impact Bond Fund
read more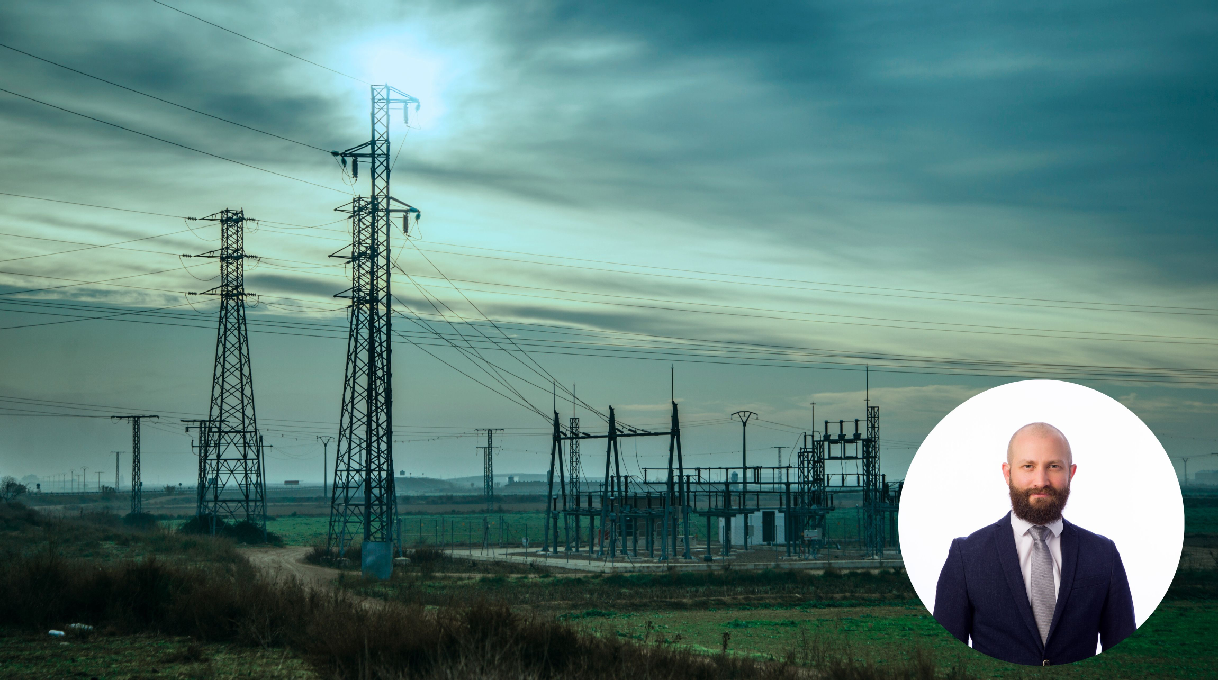
Opinion 20 May 2025
What the blackouts in Spain and Portugal could mean for green infrastructure investment
read more

In the News 30 Apr 2025
Regulation and political polarisation: Why one step back could mean two steps forward
read more
In the News 22 Apr 2025
ACT Signatory Journey: ‘Collaborative engagement is key to wider progress’
read more

Video 11 Mar 2025
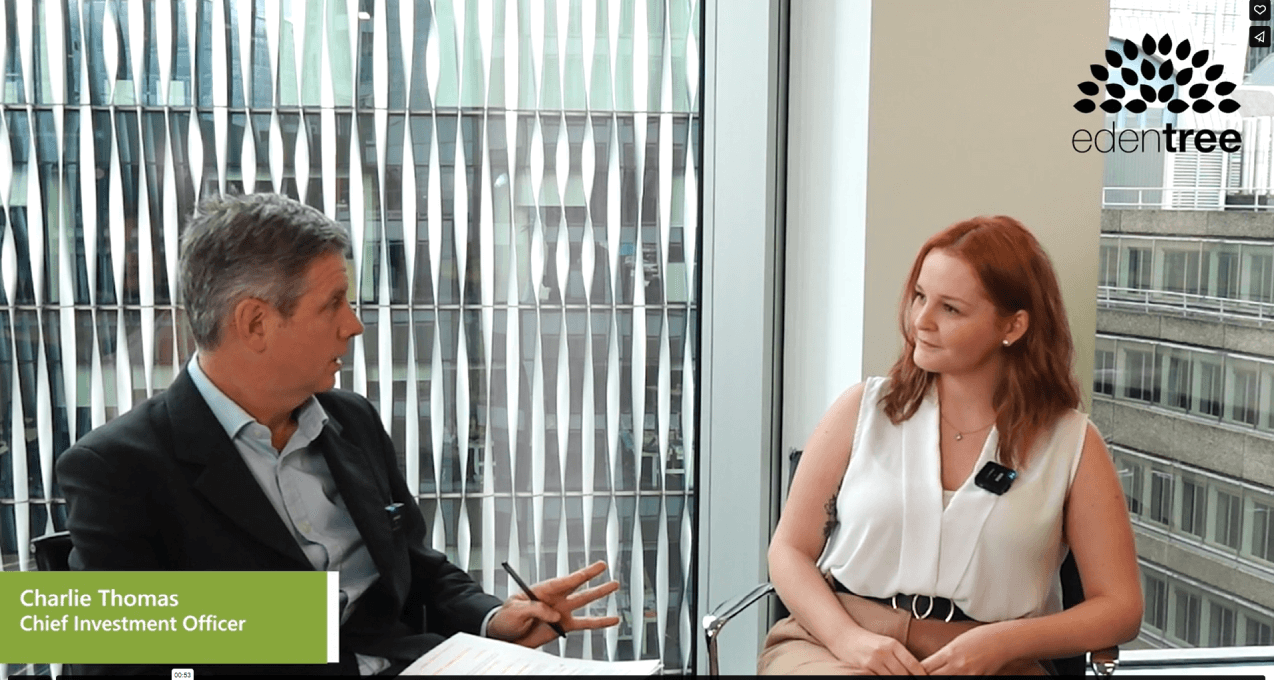
Webinar: EdenTree Investment Insights – What’s next for Fixed Income Markets?
read more
Video 19 Feb 2025
EdenTree’s Global Sustainable Government Bond Fund – our unique solution to the market
read more

Video 20 Jan 2025