
In 2016, we began measuring the carbon footprint of our funds. Since then, both the data and the way we use it has evolved considerably.
A decade of carbon footprinting gives us the ability to step back from short-term fluctuations and consider how the carbon profile of our investments has changed over the long term.
The picture is encouraging. Despite variations in annual movements, our analysis shows that carbon intensity has declined materially across the funds included in our assessment.
A decade of data
Carbon footprinting allows us to measure and analyse the greenhouse gas emissions (GHGs) associated with our investments. By carrying out this exercise annually since 2016, we have built a long-term picture of how the carbon profile of our funds has changed and where financed emissions continue to be concentrated.
Our latest analysis covers nine funds for which sufficiently established carbon footprinting methodologies and data are available1, including four equity funds for which we now have a full decade of carbon intensity data.
One of the principal metrics produced by our carbon footprinting exercise is a fund’s carbon intensity, which measures the financed emissions associated with each million pounds invested. Across the nine funds assessed, carbon intensity has fallen by at least 46%2 from each fund’s respective baseline3. All nine funds are also currently on track against their respective 2035 carbon intensity reduction targets, with several already exceeding the level of reduction required by those targets.
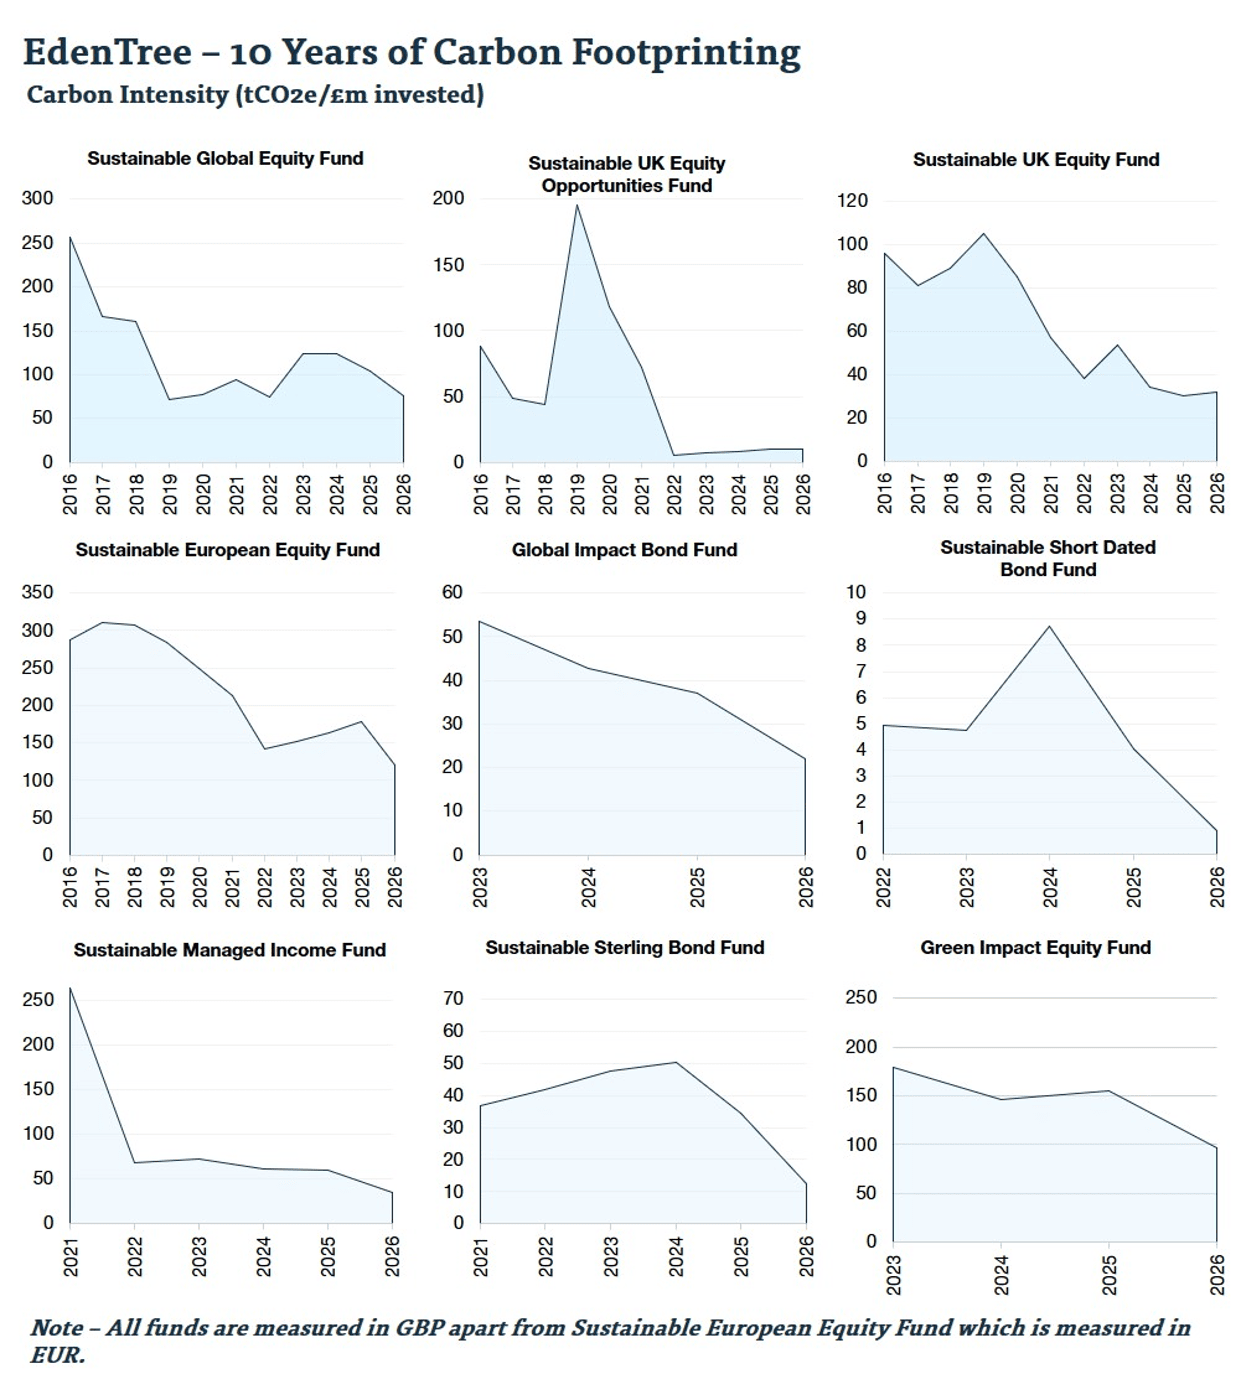
Source: EdenTree Analysis, created using carbon footprinting data from our data provider, ISS ESG. Data as of 31.03.2026.
Carbon intensity has fluctuated over the period. Changes in portfolio composition, company valuations and company-level emissions can all influence the metric from year to year, meaning a fall does not necessarily reflect a reduction in real-world emissions. This is why we place greater emphasis on the longer-term trend than on annual movements.
We also recognise that while carbon intensity is our longest-running datapoint, no single metric can provide a complete picture of a fund’s climate characteristics. We therefore consider carbon intensity alongside financed emissions, weighted average carbon intensity (WACI), implied temperature rise and science-based target (SBT) coverage. These complementary measures provide a broader view of our funds’ carbon profiles. Taken together, the results indicate that the measured carbon profile of our funds has improved substantially over the decade from 2016 to 2026, while the underlying data allows us to identify where further progress is needed4.
From measurement to action
We introduced annual carbon footprinting in 2016 to deepen our understanding of the climate characteristics and climate-related risks of our funds; the introduction of the exercise gave our Sustainable Investment Team a consistent framework for measuring the emissions associated with each portfolio and to track how this changes from year to year.
Over the past decade, the exercise has developed alongside the availability and quality of climate data. We now use the results as a part of a broader climate assessment, helping us examine each fund’s exposure to physical, regulatory and transition risks and understand the factors driving changes in its carbon profile. Crucially, the analysis has also become a practical input into our stewardship programme, helping us identify the companies and issuers responsible for the largest share of emissions, so that we can direct our stewardship activity where it is most material.
This approach underpins our Climate Stewardship Plan: a targeted monitoring and engagement programme focused on our highest-emitting companies. The majority of EdenTree’s financed emissions are concentrated in a relatively small number of holdings; as of 2026, our 20 highest emitters accounted for 82% of our financed emissions.5 This concentration reinforces the case for a focused approach, helping us identify where deeper assessment and engagement may be warranted. Given the scale of these companies’ emissions, progress in their transition is important both to reducing the carbon footprint of our funds and to achieving wider global real-world emissions reductions.
The exercise can also highlight companies that contribute significantly to an individual fund’s footprint, even where they are not among EdenTree’s largest emitters overall. This helps ensure that smaller companies with material GHGs are not overlooked simply because their absolute emissions are lower than those of much larger issuers. Such businesses may receive less attention from investors and collaborative engagement groups, creating a potentially valuable role for targeted, company-specific engagement.
A closer look at our Sustainable European Equity Fund
Carbon Intensity (tCO2e / € invested)
Source: EdenTree Analysis, created using carbon footprinting data from our data provider, ISS ESG. Data as of 31.03.2026.
The EdenTree Sustainable European Equity Fund was one of the first funds we carbon footprinted. Since 2016, its carbon intensity has decreased by 58%, against a target reduction of 78% by 2035, placing the Fund firmly on track2.
The reduction has not been consistent from year to year. After falling between 2017 and 2021, carbon intensity rose between 2022 and 2025, before falling sharply in 2026. This reinforces the value of looking at the longer-term trend rather than individual annual movements.
Looking more closely at the Fund’s footprint also shows where its emissions are concentrated. Its ten largest emitters account for 89.3% of scope 1 and 2 financed emissions, with the top three accounting for more than 65%2. Seven of the ten largest emitters are included in our Climate Stewardship Plan and together represent over 81% of the Fund’s financed emissions2. This helps us identify where enhanced monitoring and engagement may be most relevant.
Other metrics also provide further context. Since 2016, the Fund’s weighted average carbon intensity (WACI), a measure of the carbon intensity of its underlying companies relative to their revenues, has fallen by 42%2. At the latest assessment, both its WACI and implied temperature rise, a forward-looking measure that estimates the degree of warming with which the Fund’s investments are aligned, were lower than those of its benchmark, the MSCI Europe. A greater proportion of the Fund’s companies also had approved science-based targets (SBTs), which provide independent validation that companies’ emissions-reduction targets are aligned with climate science. These indicators suggest that the Fund currently has lower exposure to carbon-intensive companies than its benchmark, alongside stronger forward-looking climate alignment and greater exposure to companies with independently validated emissions-reduction targets.
Looking ahead: why we will continue carbon footprinting
Ten years of carbon footprinting has given us a valuable long-term perspective on how the carbon profile of our investments can change. For EdenTree, footprinting is not simply a reporting exercise, it supports the investment process, helps us understand the climate-related risks within our funds and provides an evidence base for prioritising stewardship where it is most warranted.
The results also remind us to differentiate improvements in portfolio metrics from reductions in real-world emissions, and to examine the absolute emissions behind both. As our dataset grows, we expect to be able to identify long-term trends, reversals and areas of persistent exposure.
We are encouraged by the progress achieved to date, but there remains considerably more to do if we are to limit global warming and achieve net zero by 2050. We will therefore continue to footprint our funds annually, publish the results transparently and use them to inform rigorous engagement with the companies in which we invest.
How do we measure carbon intensity?
To calculate a fund’s carbon intensity, we measure the financed emissions associated with each million pounds invested by attributing a share of each company’s scope 1 and 2 greenhouse gas emissions to the fund based on its ownership share. For example, if a company emits one million tonnes of carbon dioxide equivalent, and the fund owns 1% of the company, 10,000 tonnes would be attributed to the fund6. We then aggregate the attributed emissions from all holdings and divide the total by the value of the fund, producing a carbon intensity figure expressed as tonnes of carbon dioxide equivalent per £1 million invested.
Currently, as is standard practice, our carbon footprinting analysis is limited to scope 1 and 2 emissions, excluding scope 3, reflecting the significant limitations associated with scope 3 data, which is often incomplete, inconsistent or unavailable. Where data is reported, it frequently relies on estimates or self-disclosed figures that lack independent verification, reducing its reliability as an input for carbon footprinting. Moreover, scope 3 emissions are interconnected across value chains, increasing the risk of double counting. For instance, emissions from a single supplier may be attributed to multiple downstream companies, complicating fund-level aggregation and analysis.
Disclaimer
This document has been prepared by EdenTree Investment Management Limited and has been produced for information purposes only and as such the views contained herein are not to be taken as advice or recommendation to buy or sell any investment or interest thereto.
No forecasts can be guaranteed and there is no guarantee that the information supplied is complete or timely, nor are there any warranties with regard to the results obtained from its use. EdenTree is the source of data unless otherwise indicated.
Capital at risk. The value of an investment and the income from it may go down as well as up and the investor may not get back the amount initially invested. Selecting stocks due to our ethical criteria means that the choice of stocks is limited to a subset of the stock market and this could lead to greater volatility.
This marketing communication is issued by EdenTree Investment Management Limited (EdenTree) Reg. No. 2519319. Registered in England at Benefact House, 2000, Pioneer Avenue, Gloucester Business Park, Brockworth, Gloucester, GL3 4AW, United Kingdom. EdenTree is authorised and regulated by the Financial Conduct Authority and is a member of the Investment Association.
Firm Reference Number 527473.
Phone 0800 011 3821
Email clientservice@edentree.com
edentreeim.com
Sources
- This includes all our open-ended funds except the Global Sustainable Government Bond Fund and Green Impact Infrastructure Fund, which invest primarily in sovereign debt and listed infrastructure, respectively, asset classes where methodologies and data coverage remain at a more nascent stage.
- Source: EdenTree Analysis, created using carbon footprinting data from our data provider, ISS ESG. Data as of 31.03.2026.
- Baseline years vary between funds, reflecting differences in their inception dates and the availability of suitable historical data.
- In the interests of transparency, we publish the full results of our carbon footprinting exercise in our annual Climate Stewardship Report. Our 2025/2026 Report will be published in November 2026.
- Data as of 31.03.2026. Source: ISS ESG, EdenTree
- For listed equities, we calculate ownership share using market capitalisation. For fixed-income securities, it is calculated using enterprise value including cash (EVIC).